Limited Time Offer!
For Less Than the Cost of a Starbucks Coffee, Access All DevOpsSchool Videos on YouTube Unlimitedly.
Master DevOps, SRE, DevSecOps Skills!
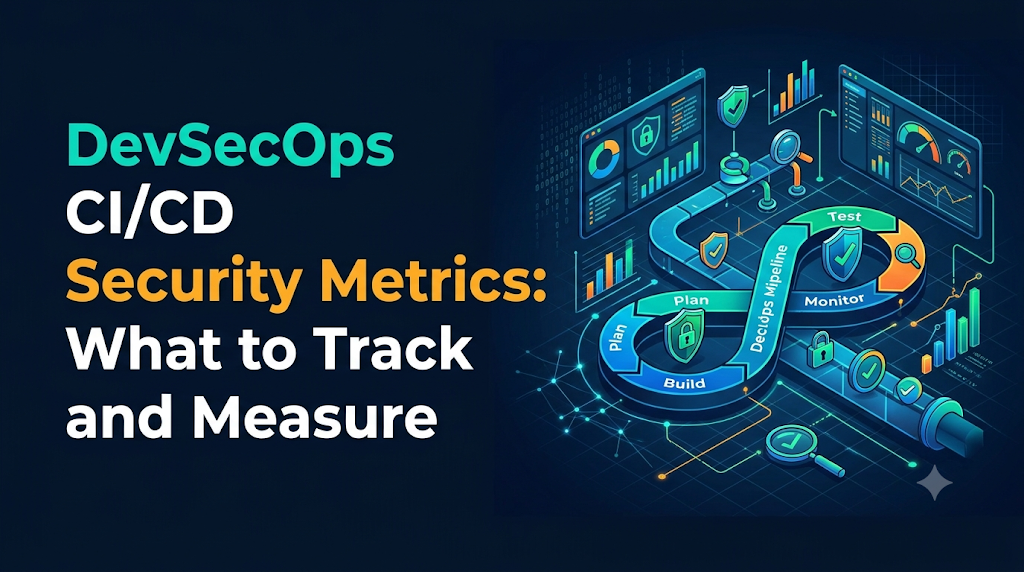
Imagine a modern engineering team that has successfully automated its software delivery lifecycle, only to realize during a routine audit that they have no data-driven way to prove their security controls are actually reducing risk. This common trap highlights a dangerous engineering assumption: that successful pipeline execution automatically equals secure software delivery. To bridge the gap between rapid delivery and operational security, organizations must track meaningful DevSecOps CI/CD security metrics that measure vulnerability management, testing coverage, and pipeline performance throughout the software delivery lifecycle.
Understanding Metrics in a DevSecOps Pipeline
DevSecOps embeds security validation directly into the CI/CD automation workflow. Rather than treating security as a final gatekeeper before release, teams integrate checks continuously from the initial code commit to production monitoring. However, collecting security data without a clear framework leads to noise rather than insight.
To build an effective measurement strategy, engineering and security teams must distinguish between several commonly confused concepts:
- Security Metrics vs. Security KPIs: Security metrics are raw measurements of operational characteristics (such as the number of open vulnerabilities or scan execution time). Security Key Performance Indicators (KPIs) are strategic targets tied to business goals (such as keeping critical vulnerability remediation under 7 days).
- Vulnerability Counts vs. Actual Risk Exposure: A high count of low-risk, unexploitable vulnerabilities in a non-production dependency represents minimal actual risk. Conversely, a single unpatched, publicly exploitable remote code execution flaw in an internet-facing service represents severe risk, regardless of overall low vulnerability counts.
- Security Activity vs. Security Effectiveness: Running a vulnerability scan every hour demonstrates security activity. Finding, fixing, and verifying the closure of exploitable flaws demonstrates security effectiveness.
- Compliance Reporting vs. Operational Security: Compliance reporting focuses on satisfying static checklists for auditors. Operational security focuses on tracking live threat vectors, developer feedback loops, and real-time pipeline posture.
Map the Pipeline Before Choosing Metrics
Security metrics lose their value when collected as isolated numbers. To make security data actionable, teams must map metrics directly to specific stages of the CI/CD pipeline.
[Source Code & Commit] ──> [Build & Dependencies] ──> [Automated Testing] ──> [Artifact Creation] ──> [IaC Validation] ──> [Deployment Approval] ──> [Production Monitoring]
- Source Code and Commit Validation: Captures insecure coding patterns, hardcoded secrets, and unauthorized modifications as soon as developers push code.
- Build and Dependency Management: Evaluates external libraries, open-source packages, and third-party components for known vulnerabilities.
- Automated Testing: Assesses compiled application security through deep static and dynamic analysis.
- Container and Artifact Creation: Inspects base images, compiled binaries, and packaging configurations before distribution.
- Infrastructure as Code (IaC) Validation: Scans cloud provisioning templates, Kubernetes manifests, and network configurations for misconfigurations.
- Deployment and Release Approval: Evaluates final security gate compliance, policy exceptions, and risk scores before pushing code to production.
- Production Monitoring: Tracks runtime behavior, unauthorized access attempts, and active exploit patterns.
The Essential DevSecOps CI/CD Security Metrics
This section outlines the core technical metrics required to evaluate security performance across the CI/CD pipeline.
Vulnerability Management
Total Vulnerabilities Detected
- Meaning: The total count of security flaws identified across repositories and environments.
- Measurement Approach: Aggregated daily or per-build from static and dynamic scanners.
- Practical Value: Establishes a baseline volume of security findings across the organization.
- Limitations: Raw counts do not reflect severity, exploitability, or context. A high count of low-severity issues can obscure critical risks.
Critical and High-Severity Vulnerability Count
- Meaning: The number of severe security flaws capable of causing data breaches, system compromise, or remote code execution.
- Measurement Approach: Categorized using Common Vulnerability Scoring System (CVSS) ratings (e.g., CVSS 7.0 to 10.0).
- Practical Value: Directs immediate engineering attention toward high-impact risks that require urgent remediation.
Mean Time to Remediate (MTTR)
- Meaning: The average duration required for a team to investigate, fix, and verify a vulnerability from the moment it is detected.
- Measurement Approach: Calculated by tracking the timestamp of vulnerability detection against the timestamp of verified fix closure across a given period.
- Formula:$$\text{MTTR} = \frac{\sum (\text{Remediation Timestamp} – \text{Detection Timestamp})}{\text{Total Vulnerabilities Remediated}}$$
- Practical Value: Measures the efficiency and responsiveness of the engineering team in handling security debt.
Vulnerability Aging
- Meaning: The distribution of open vulnerabilities grouped by how long they have remained unpatched.
- Measurement Approach: Calculated by measuring the current age of all open findings (e.g., 0–30 days, 31–90 days, 90+ days).
- Practical Value: Prevents critical findings from lingering indefinitely in legacy codebases.
Vulnerability Recurrence Rate
- Meaning: The percentage of fixed vulnerabilities that reappear in subsequent builds or releases.
- Measurement Approach: Tracking findings that match previously closed vulnerability signatures within a rolling 90-day window.
- Formula:$$\text{Recurrence Rate} = \left( \frac{\text{Number of Recurrent Vulnerabilities}}{\text{Total Vulnerabilities Fixed}} \right) \times 100$$
- Practical Value: Identifies whether development teams are applying root-cause fixes or merely implementing temporary workarounds.
Security Testing Coverage
Percentage of Repositories Covered by SAST
- Meaning: The proportion of active source code repositories integrated with Static Application Security Testing tools.
- Measurement Approach: Comparing repositories with active SAST pipeline jobs against the total organizational repository inventory.
- Formula:$$\text{SAST Coverage (\%)} = \left( \frac{\text{Repositories with Active SAST}}{\text{Total Active Repositories}} \right) \times 100$$
- Practical Value: Ensures no legacy or forgotten codebases bypass static code review.
Software Composition Analysis (SCA) Coverage
- Meaning: The proportion of applications and services actively scanned for vulnerable open-source dependencies.
- Measurement Approach: Tracking dependency manifest files (e.g.,
package.json,pom.xml,requirements.txt) processed by SCA tools during builds.
Dynamic Application Security Testing (DAST) Coverage
- Meaning: The proportion of running web applications and APIs subjected to automated runtime security testing.
- Measurement Approach: Comparing deployed staging and production endpoints against registered DAST scan targets.
Container Image Scanning Coverage
- Meaning: The percentage of container images scanned for OS package vulnerabilities and misconfigurations prior to deployment.
- Measurement Approach: Tracking images built in the CI/CD pipeline that successfully pass through an automated container registry scan.
Infrastructure as Code (IaC) Scanning Coverage
- Meaning: The percentage of infrastructure definition files (Terraform, CloudFormation, Kubernetes YAML) evaluated by security linters before provisioning.
- Measurement Approach: Measuring IaC pull requests evaluated by security linters against total IaC pull requests merged.
Secret Detection Coverage
- Meaning: The percentage of code commits and pull requests scanned for accidental credential, API key, and certificate leaks.
- Measurement Approach: Monitoring pre-commit hook execution and central repository scan logs.
Pipeline Security Performance
Percentage of Builds Passing Security Gates
- Meaning: The proportion of CI/CD builds that successfully satisfy defined security criteria without triggering blockages.
- Measurement Approach: Tracking pipeline execution logs for build success versus security gate failures over a monthly period.
- Formula:$$\text{Security Gate Pass Rate (\%)} = \left( \frac{\text{Builds Passing Security Gates}}{\text{Total Builds Executing Security Checks}} \right) \times 100$$
- Practical Value: Evaluates whether security checks are practical or overly restrictive for daily engineering velocity.
Security-Related Pipeline Failure Rate
- Meaning: The frequency at which builds fail strictly due to security threshold violations.
- Measurement Approach: Analyzing pipeline failure logs categorized by failure reason (test failure vs. security gate failure).
Time Taken by Security Scans
- Meaning: The duration security tools add to the overall CI/CD pipeline execution time.
- Measurement Approach: Measuring the elapsed time from the start to the completion of security scanning jobs within a build.
- Practical Value: Prevents security tooling from introducing bottlenecks that frustrate developers and encourage pipeline bypassing.
False-Positive Rate
- Meaning: The percentage of security findings flagged by automated tools that are determined to be irrelevant or incorrect upon human review.
- Measurement Approach: Tracking dismissed or marked false-positive findings against total findings generated.
- Formula:$$\text{False-Positive Rate (\%)} = \left( \frac{\text{False Positives Flagged}}{\text{Total Security Findings Generated}} \right) \times 100$$
- Practical Value: High false-positive rates erode developer trust in security tooling and lead to alert fatigue.
Security Findings Detected Before Production
- Meaning: The ratio of vulnerabilities intercepted in pre-production pipeline stages versus those discovered in live production environments.
- Measurement Approach: Comparing internal pipeline scan findings against post-deployment penetration testing or incident reports.
Security Exceptions and Policy Violations
- Meaning: The volume of formal override requests submitted by engineering teams to bypass security gates for urgent releases.
- Measurement Approach: Tracking approved security exception tickets logged in tracking systems over a quarter.
Software Supply Chain Security
Percentage of Dependencies with Known Vulnerabilities
- Meaning: The proportion of third-party libraries in active use that contain documented Common Vulnerabilities and Exposures (CVEs).
- Measurement Approach: Aggregating SCA inventory reports across all production applications.
Percentage of Builds Using Approved Base Images
- Meaning: The proportion of container builds relying on organization-vetted, hardened base images rather than untrusted public registries.
- Measurement Approach: Auditing Dockerfile
FROMinstructions against approved container registry registries.
Signed Artifact Coverage
- Meaning: The percentage of released binaries, containers, and deployment packages cryptographically signed to guarantee integrity.
- Measurement Approach: Tracking release artifacts carrying valid cryptographic signatures (e.g., Cosign, Notation) against total releases.
Software Bill of Materials (SBOM) Generation Coverage
- Meaning: The proportion of software releases accompanied by an automated, machine-readable inventory of all included components.
- Measurement Approach: Monitoring automated SBOM generation tasks integrated into release pipelines.
Dependency Update and Patch Compliance
- Meaning: The speed and consistency with which development teams update outdated dependencies following security patches.
- Measurement Approach: Tracking the time elapsed between upstream patch release and internal dependency upgrade deployment.
Access and Secrets Protection
Unauthorized Pipeline Access Attempts
- Meaning: The number of blocked authentication or authorization failures originating from pipeline runner environments.
- Measurement Approach: Analyzing CI/CD orchestration platform audit logs for permission violations.
Secrets Detected in Source Code or Logs
- Meaning: The frequency with which API tokens, passwords, or private keys are accidentally committed to code repositories or printed in build logs.
- Measurement Approach: Counting secret scanning alerts triggered during pre-commit or CI build stages.
Credential Rotation Compliance
- Meaning: The percentage of service accounts, pipeline tokens, and database credentials rotated within required policy timeframes.
- Measurement Approach: Auditing secret management systems (e.g., HashiCorp Vault, AWS Secrets Manager) for rotation timestamps.
Privileged Pipeline Account Usage
- Meaning: The frequency of builds executing with administrative or root-level privileges within runner environments.
- Measurement Approach: Monitoring pipeline configuration files for elevated permission flags.
Access Policy Violations
- Meaning: The number of unauthorized attempts by users or service accounts to modify CI/CD pipeline security configurations.
- Measurement Approach: Reviewing role-based access control (RBAC) audit logs on CI/CD platforms.
How to Interpret Metrics Without Misleading the Team
A common mistake in metric-driven security is evaluating numbers in isolation. For example, a team that implements a new, highly rigorous Static Application Security Testing tool may suddenly see their total vulnerability count jump by 300%. If evaluated superficially, leadership might assume the team’s security posture is deteriorating. In reality, the security posture is improving because the team now has visibility into flaws that were previously hidden.
To interpret metrics accurately, organizations must avoid several common pitfalls:
- Focusing Only on Total Counts: Raw numbers do not reflect exploitability. A vulnerability behind multiple layers of internal network controls carries a different risk profile than an unauthenticated remote flaw on an internet-facing gateway.
- Treating Every Finding as Equally Important: Prioritization must be driven by context, asset criticality, and threat intelligence rather than strict CVSS numbers alone.
- Rewarding Suppression: Metrics that reward teams solely for reducing open vulnerability counts can incentivize developers to mark valid findings as false positives rather than fixing them.
- Ignoring Coverage Gaps: A team reporting zero vulnerabilities across three scanned repositories out of fifty total company repositories is not secure; they simply lack comprehensive coverage.
- Comparing Disparate Teams: Comparing the vulnerability metrics of a legacy monolithic enterprise database application with a lightweight, containerized microservice API creates unfair and inaccurate performance assessments.
Effective interpretation requires synthesizing severity, asset exposure, business impact, and remediation velocity into a cohesive risk narrative.
Building a Practical Security Metrics Dashboard
A successful DevSecOps dashboard must serve distinct stakeholders: developers need actionable bug lists, security engineers need vulnerability trends, and engineering leaders need high-level risk visibility.
Dashboard Category Structure
| Dashboard Category | Primary Target Audience | Key Metrics Tracked | Suggested Visualization |
| Vulnerability Health | Security Engineers & Developers | Critical/High counts, MTTR, Aging | Trend line charts, Stacked bar graphs |
| Testing Coverage | DevSecOps Leads & Management | SAST, SCA, DAST, IaC coverage % | Percentage gauges, Coverage matrices |
| Pipeline Status | Engineering Teams | Gate pass rate, Scan duration, Failure rate | Time-series charts, Status badges |
| Supply Chain | Security Operations | SBOM coverage, Vulnerable dependencies | Pie charts, Component risk tables |
| Access Compliance | Compliance Officers | Secret leaks, Credential rotation | Audit logs, Violation counter tiles |
Illustrative Security Dashboard Example (Hypothetical Values)
- Overall Pipeline Security Score: $88/100$
- SAST Repository Coverage: $94\%$
- Critical Vulnerabilities Open: $3$ (Average age: 14 days)
- Mean Time to Remediate (MTTR): $6.2\text{ days}$
- Security Gate Pass Rate: $91\%$
- SBOM Generation Coverage: $100\%$
Reporting Frequency: Weekly operational reviews for engineering leads; monthly strategic risk summaries for executive leadership. Alert thresholds should trigger immediate Slack or PagerDuty notifications if critical vulnerabilities exceed zero in production-bound branches.
A Practical Example: Measuring Security in a CI/CD Workflow
To understand how security metrics function in a real-world engineering environment, consider a mid-sized SaaS development team transitioning their legacy deployment pipeline to an automated DevSecOps model.
- Establish the Current Security Baseline: The team runs an initial audit across all active repositories. They discover an unknown number of third-party dependency vulnerabilities and lack visibility into container image safety.
- Identify Pipeline Stages Needing Security Checks: They map their GitLab CI/CD pipeline and decide to insert checks at commit (secret detection), build (SCA and container scanning), and test (SAST).
- Select Measurable Security Indicators: The team chooses four core metrics to track initially: SAST coverage percentage, critical/high vulnerability count, build gate pass rate, and MTTR.
- Integrate Automated Scanning and Reporting: Security linters and scanners are added to pipeline configuration files. Scan results are centralized into an application security dashboard.
- Define Severity-Based Security Gates: The pipeline is configured to automatically block any merge request introducing a new critical vulnerability with a CVSS score above 9.0.
- Track Remediation and Exceptions: Developers review findings directly inside their pull requests. An exception review board is established for urgent business releases requiring temporary waivers.
- Review Results and Improve the Pipeline: After 30 days, the team reviews their metrics. They notice a high false-positive rate in one SAST rule, which they tune to reduce developer friction while maintaining high security visibility.
Connecting Metrics With Security Tools and Automation
Security metrics rely on data generated by automated tooling integrated directly into the CI/CD ecosystem. While specific product choices vary across organizations, the integration patterns remain consistent:
- SAST & DAST Scanners: Integrated into build and test stages to output structured findings (e.g., SARIF format) consumed by dashboard aggregators.
- Software Composition Analysis (SCA): Embedded during dependency resolution to check package lockfiles against known vulnerability databases.
- Container Security Scanners: Executed immediately after image construction to inspect base layers and OS packages before pushing to artifact registries.
- IaC Security Scanners: Run against infrastructure code during pull request reviews to catch cloud misconfigurations early.
- Secret Detection Tools: Utilized as pre-commit hooks and CI pipeline steps to prevent credential leaks.
- Artifact Signing & SBOM Tools: Automated during release packaging to ensure supply chain integrity and compliance.
- Orchestration Platforms: Platforms like GitHub Actions, GitLab CI/CD, Jenkins, and Azure DevOps serve as the execution engine capturing build durations, gate outcomes, and pipeline status metrics.
Establishing Useful Security Targets and Ownership
Metrics are only effective when paired with clear ownership and realistic targets. When targets are arbitrary or disconnected from engineering realities, they fail to drive behavioral change.
- Metric Ownership: Assign clear responsibilities. Engineering leads own remediation velocity and pipeline pass rates; security engineering owns tool configuration, false-positive tuning, and policy definitions.
- Remediation Service-Level Targets (SLAs): Establish timeframes based on severity (e.g., critical vulnerabilities patched within 7 days, high within 30 days, medium within 90 days).
- Security Gate Policies: Define strict rules for production deployments while allowing flexible warning states for non-production branches to prevent developer burnout.
- Exception Approval and Expiry: Require all security exceptions to have a defined business justification, compensating controls, and a strict expiration date (e.g., maximum 30 days).
- Regular Metric Reviews: Schedule bi-weekly retrospectives where security and development teams jointly analyze trends, bottlenecks, and recurring failure patterns.
As professionals explore structured approaches to implementing these practices, educational resources such as DevOpsSchool offer comprehensive guidance for mastering DevOps and DevSecOps frameworks.
Common Challenges and Ways to Improve Measurement
Implementing security metrics across a fast-paced engineering organization often introduces friction. Below are common challenges and practical ways to overcome them:
- Incomplete Scanner Coverage:
- Challenge: Legacy services or orphaned repositories lack security instrumentation.
- Improvement: Implement automated repository discovery scripts that flag unmonitored projects during onboarding.
- Noisy Alerts and Alert Fatigue:
- Challenge: Scanners generate thousands of low-value alerts, overwhelming developers.
- Improvement: Tune scanning ruleset thresholds and prioritize findings based on runtime reachability and exploitability data.
- Developer Resistance:
- Challenge Security gates perceived as arbitrary roadblocks that slow down feature delivery.
- Improvement: Involve developers in defining threshold rules and ensure security feedback is delivered directly inside their native pull-request workflows.
- Fragmented Reporting:
- Challenge: Data is trapped inside isolated security tool dashboards.
- Improvement: Aggregate findings into a centralized DevSecOps dashboard or reporting platform for unified visibility.
- Outdated Vulnerability Data:
- Challenge: Vulnerability databases update faster than internal scan cycles.
- Improvement: Transition from scheduled batch scans to event-driven, continuous scanning triggered on every dependency update or code commit.
A 30-Day Plan to Introduce DevSecOps Security Metrics
To help engineering teams roll out a practical security measurement program without overwhelming existing workflows, follow this structured 30-day adoption roadmap:
Week 1: Review and Baseline
- Focus: Audit existing CI/CD pipelines and catalog active repositories.
- Deliverables: A comprehensive inventory of current security tools, coverage gaps, and a baseline count of open high-severity vulnerabilities.
Week 2: Select Priority Metrics and Integrate Data Collection
- Focus: Choose 4 to 5 foundational metrics (e.g., SAST coverage, critical vulnerability count, MTTR, and build pass rate) and integrate automated collection into pipeline stages.
- Deliverables: Automated data feeds flowing from scanners into a centralized reporting view.
Week 3: Build Dashboards and Define Governance
- Focus: Create role-based dashboard views for developers and leadership. Establish severity-based security gates and remediation SLAs.
- Deliverables: Operational dashboards live and initial security gate policies enforced on non-production branches.
Week 4: Review, Refine, and Document
- Focus: Conduct the first cross-functional review meeting with engineering and security teams. Analyze false positives, adjust thresholds, and document the measurement process.
- Deliverables: A finalized security metrics playbook, tuned scanning rules, and an established cadence for ongoing review.
Final Thoughts: Measure Security to Improve Delivery
Effective DevSecOps measurement is not about accumulating the largest volume of security statistics or chasing flawless dashboard scores. True security success is measured by how quickly teams can identify risks, how effectively developers and security professionals collaborate to remediate flaws, and how resilient software delivery pipelines become over time. By tracking the right metrics across every stage of the CI/CD lifecycle, organizations transform security from a disruptive bottleneck into a seamless, continuous enabler of trustworthy software delivery. For professionals seeking to deepen their expertise in modern engineering practices, organizations like DevOpsSchool provide valuable educational resources to support ongoing learning in DevOps and DevSecOps disciplines.
