Limited Time Offer!
For Less Than the Cost of a Starbucks Coffee, Access All DevOpsSchool Videos on YouTube Unlimitedly.
Master DevOps, SRE, DevSecOps Skills!
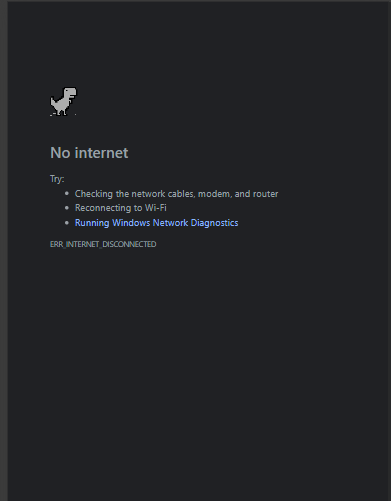
When Chrome Developer Tools (DevTools) are open and the page is refreshed, it throws a “No Internet” screen with
ERR_INTERNET_DISCONNECTED.
This guide walks you through every cause and its solution, with visuals and best practices.
🚩 Why This Happens
This error can be triggered even when you’re online, typically due to:
- DevTools misconfigurations
- Simulated offline mode
- Caching issues
- Extension or proxy interference
✅ Step-by-Step Fixes
🔹 Step 1: Check if “Disable Cache” is ON
When DevTools is open, Chrome disables caching by default.
🔍 Steps:
- Open DevTools (F12 or
Ctrl + Shift + I). - Go to the Network tab.
- Uncheck the “Disable cache” checkbox (at the top).
🧠 Note: This setting is only active when DevTools is open.
🔹 Step 2: Ensure DevTools is Set to “Online”
DevTools lets you simulate offline networks for testing — make sure it’s not stuck in “Offline” mode.
🔍 Steps:
- In DevTools, go to Network tab.
- Look at the top bar → Click the dropdown labeled “Online” or “Offline”.
- Select “Online” if not already selected.
📸 You should see:
Throttling: [ Online ▼ ]
🔹 Step 3: Turn Off Chrome Extensions (Temporarily)
Some Chrome extensions (e.g., VPNs, privacy blockers, proxies) interfere with DevTools.
🔍 Steps:
- Go to:
chrome://extensions - Disable all extensions.
- Refresh the page with DevTools open.
- If the issue goes away, re-enable extensions one by one to find the culprit.
🔹 Step 4: Disable Antivirus/Firewall (Temporarily)
Security software may block outgoing connections when debugging tools are in use.
🔍 Steps:
- Temporarily disable antivirus, firewall, or network protection software.
- Retry refreshing the page.
If it works, add Chrome to the allowed list of your security tools.
🔹 Step 5: Check Proxy Settings
Misconfigured proxy settings (especially in corporate networks or VPNs) can block Chrome connections.
🔍 Steps:
- Go to Chrome Settings →
chrome://settings/ - Scroll down and click “System”.
- Click “Open your computer’s proxy settings”.
- Ensure:
- No proxy is active, unless intentionally set.
- Automatic proxy detection is off (if not needed).
🔹 Step 6: Test in Incognito Mode
Incognito mode disables extensions by default.
🔍 Steps:
- Press
Ctrl + Shift + Nto open an Incognito window. - Open DevTools → Refresh page.
If it works, the issue is most likely caused by extensions or cache.
🔹 Step 7: Update or Reinstall Chrome
Corrupted Chrome settings or outdated versions can lead to unexpected network behavior.
🔍 Steps:
- Go to
chrome://settings/help - Chrome will check and apply updates.
- Restart the browser.
If issues persist, consider uninstalling and reinstalling Chrome completely.
💡 Pro Tips
- ✅ Use Chrome Profiles to isolate dev tools and avoid cross-interference.
- 🔒 Always back up your Chrome settings/bookmarks before resetting.
- 🧪 Use the “Network Conditions” tab (under DevTools > More Tools) to simulate slower networks safely — but turn it off afterward.
🧑💻 Common Use Cases Where This Error Happens
| Scenario | Cause | Solution |
|---|---|---|
| Refreshing page with DevTools open | “Offline” mode enabled | Switch to “Online” in DevTools |
| DevTools > Disable Cache checked | Network reloads ignored cached content | Uncheck “Disable cache” |
| Using VPN/Proxy | Proxy blocks DevTools requests | Reconfigure or disable proxy |
| Security software blocking traffic | DevTools traffic seen as suspicious | Add Chrome to firewall exceptions |
✅ Final Checklist Before Refreshing
- “Disable Cache” is unchecked
- Throttling is set to Online
- VPN/Proxy is disabled
- Extensions are disabled (try Incognito)
- Antivirus/Firewall is not interfering
- Chrome is up to date