Limited Time Offer!
For Less Than the Cost of a Starbucks Coffee, Access All DevOpsSchool Videos on YouTube Unlimitedly.
Master DevOps, SRE, DevSecOps Skills!
When a website, API, Laravel application, microservice, database, or authentication service suddenly becomes slow or unstable, the first mistake many people make is directly checking the application code.
But in production, many issues are not caused by code only. They can come from:
Disk full issue
Low RAM
Network routing issue
Too many open connections
DNS failure
Server port exhaustion
High socket usage
Low file descriptor limit
Database overload
Apache/Nginx/PHP-FPM pressure
Laravel log permission issue
That is why every developer, DevOps engineer, and system administrator should know these basic Linux diagnostic commands:
ip route
ip addr
df -h
free -m
ulimit -n
cat /proc/sys/net/ipv4/ip_local_port_range
ss -s
These commands help you understand the server condition before making any major change.
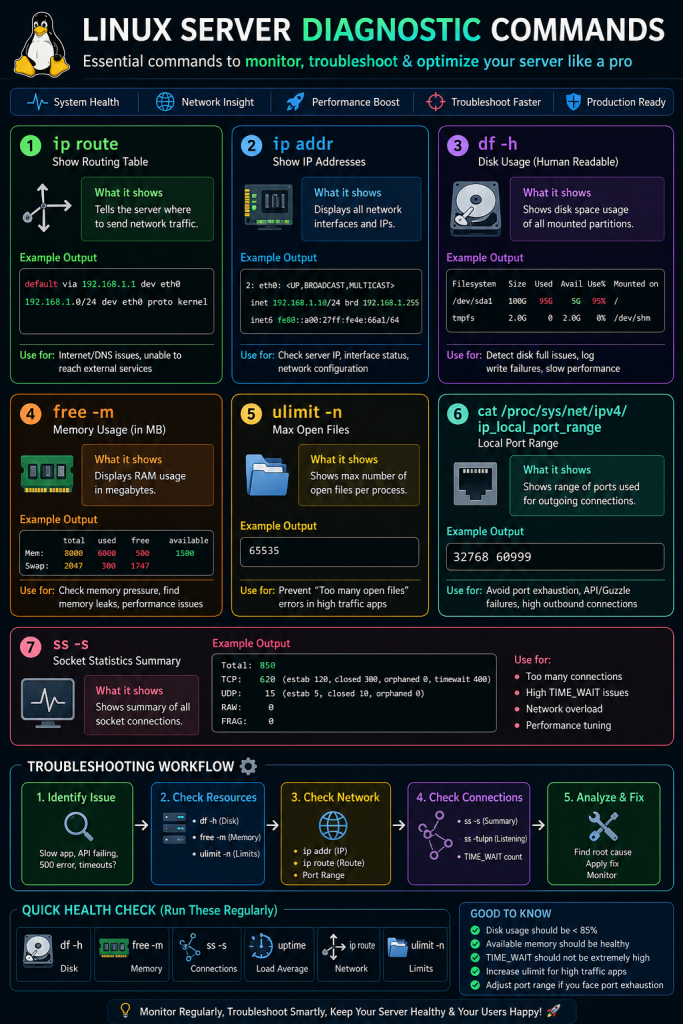
1. ip route Command
What is ip route?
The ip route command shows the routing table of your Linux server.
In simple words, it tells the server:
Where should network traffic go?
Which gateway should be used?
Which network interface is responsible for internet traffic?
How does the server reach external IPs?
Command
ip route
Example Output
default via 172.31.0.1 dev eth0
172.31.0.0/20 dev eth0 proto kernel scope link src 172.31.6.53
Meaning of Output
default via 172.31.0.1
This means all internet traffic goes through gateway:
172.31.0.1
This is very important. If the default route is missing, your server may not connect to external services.
dev eth0
This means the network interface being used is:
eth0
In some servers, it may be:
ens3
ens5
enp0s3
src 172.31.6.53
This is the private IP address of the server.
Why ip route is Important
Use this command when:
Your server cannot access the internet
Git pull or git push is failing
Curl request is not working
Keycloak cannot connect
Laravel Guzzle request is failing
API calls are timing out
DNS looks correct but external connection still fails
Practical Debugging Example
Suppose this command fails:
curl -I https://github.com
Then first check routing:
ip route
If there is no line starting with:
default via
then your server has no default gateway.
That means the server does not know how to send traffic outside its local network.
Safe Command
ip route
This is completely safe. It only reads information.
2. ip addr Command
What is ip addr?
The ip addr command shows all network interfaces and IP addresses configured on the server.
Command
ip addr
Example Output
1: lo: <LOOPBACK,UP,LOWER_UP>
    inet 127.0.0.1/8

2: eth0: <BROADCAST,MULTICAST,UP,LOWER_UP>
    inet 172.31.6.53/20
Important Parts
lo
This is the loopback interface.
127.0.0.1
It is used internally by the server.
eth0
This is the main network interface.
UP
This means the network interface is active.
inet
This shows the IPv4 address.
Example:
inet 172.31.6.53/20
Why ip addr is Important
Use it when:
You want to know server IP
You want to check whether network interface is active
Apache/Nginx binding issue is suspected
Keycloak or Laravel app is listening on a wrong interface
Server cannot be reached from outside
Internal microservices cannot communicate
Practical Example
If Apache or Keycloak is running but website is not opening, check:
ip addr
Then confirm the server has the expected IP address.
Also check:
ss -tulpn
This will show which service is listening on which port.
Safe Command
ip addr
This is safe. It only displays network information.
3. df -h Command
What is df -h?
The df -h command shows disk usage of mounted filesystems.
Command
df -h
Example Output
Filesystem      Size  Used Avail Use% Mounted on
/dev/sda1        80G   74G  3.5G  96% /
tmpfs           2.0G     0  2.0G   0% /dev/shm
Meaning of Columns
Filesystem
The disk or partition name.
Example:
/dev/sda1
Size
Total disk size.
Used
Used disk space.
Avail
Free disk space available.
Use%
Percentage of disk used.
Mounted on
Where the disk is mounted.
Example:
/
means root filesystem.
Why df -h is Critical
Disk full can break many things.
For Laravel, disk full can cause:
500 error
Session write failure
Cache write failure
Log file not created
File upload failure
View cache generation failure
Queue failure
Composer install failure
Database write issues
Dangerous Disk Usage Levels
Below 70%
Usually safe.
70% to 85%
Monitor carefully.
85% to 90%
Start cleanup.
90% to 95%
Risky for production.
Above 95%
Critical. Website may fail anytime.
Common Production Error Due to Disk Full
You may see errors like:
file_put_contents(...): Failed to open stream
or:
No space left on device
or Laravel may stop writing logs.
Next Commands After df -h
If disk is full, check which folder is heavy:
du -sh /*
Then go deeper:
du -sh /var/*
du -sh /opt/*
du -sh /opt/lampp/*
du -sh /opt/lampp/htdocs/*
For Laravel projects:
du -sh storage/*
du -sh storage/logs/*
du -sh storage/app/public/*
Find large files:
find /opt/lampp/htdocs -type f -size +100M -exec ls -lh {} \;
Find large log files:
find / -type f -name "*.log" -size +100M 2>/dev/null
Safe Cleanup Examples
Clear Laravel logs carefully:
> storage/logs/laravel.log
This empties the log file but keeps the file.
Do not randomly delete system files.
Safe Command
df -h
It is safe. It only reads disk usage.
4. free -m Command
What is free -m?
The free -m command shows RAM usage in megabytes.
Command
free -m
Example Output
              total        used        free      shared  buff/cache   available
Mem:           7945        6120         420         120        1405        1510
Swap:          2047         300        1747
Meaning of Columns
total
Total RAM installed.
used
RAM currently used.
free
Completely unused RAM.
buff/cache
Memory used for caching.
available
Most important column.
It shows how much memory is available for new processes.
Do Not Only Look at free
Many beginners see low free memory and think the server is in trouble.
That is not always true.
Linux uses free RAM for cache, which is normal.
The most important column is:
available
When RAM is a Problem
If available memory is very low, for example:
available: 100 MB
then server may become slow.
You may face:
Slow website
Database slowdown
PHP-FPM workers killed
MySQL crash
Keycloak Java process memory pressure
Composer command killed
Laravel queue workers killed
Check Top Memory Processes
Use:
ps aux --sort=-%mem | head -20
This shows top memory-consuming processes.
You may see:
mysql
apache2
php-fpm
java
node
Real Production Use Case
If your Laravel website is slow:
First run:
free -m
Then:
ps aux --sort=-%mem | head -20
If MySQL or Java is consuming most memory, optimize that service instead of blaming Laravel directly.
Safe Command
free -m
It is completely safe.
5. ulimit -n Command
What is ulimit -n?
The ulimit -n command shows how many files a process can open at one time.
Command
ulimit -n
Example Output
1024
What Does “Open File” Mean?
In Linux, many things are treated like files:
Normal files
Log files
Network sockets
Database connections
API connections
Pipes
Temporary files
So this limit affects web servers, APIs, databases, and microservices.
Why It Matters
If this value is too low, high-traffic applications can fail with:
Too many open files
This can affect:
Apache
Nginx
PHP-FPM
MySQL
Redis
Node.js
Java Keycloak
Laravel queue workers
Good Production Value
For small servers:
4096
For production servers:
65535
For high-traffic systems:
100000+
Temporary Increase
ulimit -n 65535
But this applies only to the current shell/session.
Permanent Configuration
Usually set in:
/etc/security/limits.conf
Example:
www-data soft nofile 65535
www-data hard nofile 65535
root soft nofile 65535
root hard nofile 65535
For systemd services, also check service file:
LimitNOFILE=65535
Then reload systemd:
sudo systemctl daemon-reload
sudo systemctl restart apache2
or for Keycloak:
sudo systemctl restart keycloak
Safe Command
ulimit -n
Safe. It only shows the current limit.
6. cat /proc/sys/net/ipv4/ip_local_port_range
What is This?
This command shows the local ephemeral port range.
Command
cat /proc/sys/net/ipv4/ip_local_port_range
Example Output
32768 60999
What Are Ephemeral Ports?
When your server makes an outgoing connection, Linux uses a temporary local port.
Example:
Your Laravel app calls:
https://auth.myhospitalnow.com
The server may use a temporary local port like:
45231
That port stays in use during the connection.
Why It Matters
If your server makes too many outgoing connections, it can run out of temporary ports.
This is called port exhaustion.
When Port Exhaustion Happens
It can happen when:
Laravel makes many Guzzle requests
Microservices call each other frequently
Keycloak token validation happens too often
API calls do not reuse connections
Too many TIME_WAIT sockets exist
High traffic comes suddenly
External API is slow and connections stay open
Symptoms
You may see:
Connection timeout
Cannot assign requested address
Random API failure
Guzzle connection exception
Slow external API calls
Intermittent login failure
Check Current Range
cat /proc/sys/net/ipv4/ip_local_port_range
Default may be:
32768 60999
This gives around 28,000 ports.
Better Production Range
10000 65000
Temporary Change
sudo sysctl -w net.ipv4.ip_local_port_range="10000 65000"
Permanent Change
Edit:
sudo nano /etc/sysctl.conf
Add:
net.ipv4.ip_local_port_range = 10000 65000
Apply:
sudo sysctl -p
Important Warning
Do not change kernel/network settings blindly on production.
First check socket status:
ss -s
and TIME_WAIT count:
ss -tan state time-wait | wc -l
Safe Command
cat /proc/sys/net/ipv4/ip_local_port_range
Safe. It only reads the setting.
7. ss -s Command
What is ss -s?
The ss -s command shows summary of network sockets.
Command
ss -s
Example Output
Total: 850
TCP:   620 (estab 120, closed 300, orphaned 0, timewait 400)

Transport Total     IP        IPv6
RAW       0         0         0
UDP       8         6         2
TCP       320       280       40
INET      328       286       42
Important Terms
estab
Established active connections.
timewait
Connections that were closed but are still waiting before being fully released.
orphaned
Connections no longer attached to a process.
closed
Closed connections.
Why TIME_WAIT Matters
TIME_WAIT is normal.
But too many TIME_WAIT connections can cause:
Port exhaustion
Slow network performance
API failures
High socket usage
Check TIME_WAIT Count
ss -tan state time-wait | wc -l
Check Established Connections
ss -tan state established | wc -l
Check Listening Ports
ss -tulpn
This shows which services are listening.
Example:
tcp LISTEN 0 511 0.0.0.0:80
tcp LISTEN 0 511 0.0.0.0:443
tcp LISTEN 0 128 127.0.0.1:3306
tcp LISTEN 0 4096 0.0.0.0:8080
Real Use Case
If Keycloak is running, check:
ss -tulpn | grep -E '8080|8443'
If Apache is running:
ss -tulpn | grep -E ':80|:443'
If MySQL is running:
ss -tulpn | grep 3306
Safe Command
ss -s
Safe. It only shows socket summary.
Complete Production Troubleshooting Workflow
Case 1: Website is Very Slow
Run these commands:
free -m
df -h
ss -s
ps aux --sort=-%mem | head -20
ps aux --sort=-%cpu | head -20
What to Check
If RAM is low:
Check memory-heavy process.
If disk is above 90%:
Clean logs, old backups, cache files.
If socket count is very high:
Check Apache/Nginx/PHP-FPM/database connections.
Case 2: Laravel 500 Error
Run:
df -h
free -m
ls -ld storage bootstrap/cache
ls -lh storage/logs
tail -100 storage/logs/laravel.log
Common Causes
Disk full
Permission issue
Cache write issue
Log file not writable
Database connection failure
PHP memory limit
Composer autoload issue
Permission Fix Example
sudo chown -R www-data:www-data storage bootstrap/cache
sudo chmod -R 775 storage bootstrap/cache
For XAMPP/LAMPP, Apache user may be different. Check with:
ps aux | grep httpd
ps aux | grep apache
Case 3: API or Guzzle Request Failing
Run:
ip route
ip addr
cat /etc/resolv.conf
curl -I https://example.com
ss -s
cat /proc/sys/net/ipv4/ip_local_port_range
What to Check
Default route exists
DNS server is correct
External URL is reachable
Too many sockets are not open
Port range is not too small
Case 4: GitHub Pull or Push Not Working
Run:
ip route
ip addr
curl -I https://github.com
nslookup github.com
ssh -T git@github.com
Common Issues
DNS failure
SSH key issue
Remote origin missing
Network route problem
Firewall issue
Check remote:
git remote -v
If origin is missing:
git remote add origin git@github.com:OWNER/REPO.git
Case 5: Keycloak Login or Token Issue
Run:
systemctl status keycloak --no-pager
ss -tulpn | grep -E '8080|8443'
ip route
ip addr
curl -I https://auth.yourdomain.com
journalctl -u keycloak -n 100 --no-pager
What to Check
Keycloak service running
Port is listening
Domain resolves correctly
Apache/Nginx reverse proxy works
Server can reach database
No memory pressure
Recommended Daily Server Health Checklist
Run:
df -h
free -m
ss -s
uptime
Check:
Disk usage below 85%
Available RAM is healthy
Socket count is normal
Load average is not too high
Recommended Deep Diagnostic Command Set
For a full server check:
echo "===== DISK ====="
df -h

echo "===== MEMORY ====="
free -m

echo "===== LOAD ====="
uptime

echo "===== ROUTE ====="
ip route

echo "===== IP ADDRESS ====="
ip addr

echo "===== PORT RANGE ====="
cat /proc/sys/net/ipv4/ip_local_port_range

echo "===== SOCKET SUMMARY ====="
ss -s

echo "===== LISTENING PORTS ====="
ss -tulpn

echo "===== TOP MEMORY PROCESSES ====="
ps aux --sort=-%mem | head -20

echo "===== TOP CPU PROCESSES ====="
ps aux --sort=-%cpu | head -20
Safe vs Risky Commands
Safe Commands
These only read information:
ip route
ip addr
df -h
free -m
ulimit -n
cat /proc/sys/net/ipv4/ip_local_port_range
ss -s
ss -tulpn
ps aux
uptime
Be Careful With These
These change server settings:
sysctl -w
systemctl restart
rm -rf
chmod -R
chown -R
truncate
kill
reboot
Always understand before running them.
Final Conclusion
These Linux commands are not small commands. They are the foundation of real production troubleshooting.
With them, you can diagnose:
Network issues
DNS problems
Disk full errors
RAM pressure
Laravel 500 errors
Guzzle/API failures
Keycloak connectivity issues
Too many open files
Port exhaustion
High socket usage
Server performance problems
For production debugging, always follow this order:
First check disk.
Then check memory.
Then check network route.
Then check sockets.
Then check ports.
Then check service logs.
Then check application logs.
This approach saves time, avoids guesswork, and helps you fix real problems safely.