Limited Time Offer!
For Less Than the Cost of a Starbucks Coffee, Access All DevOpsSchool Videos on YouTube Unlimitedly.
Master DevOps, SRE, DevSecOps Skills!
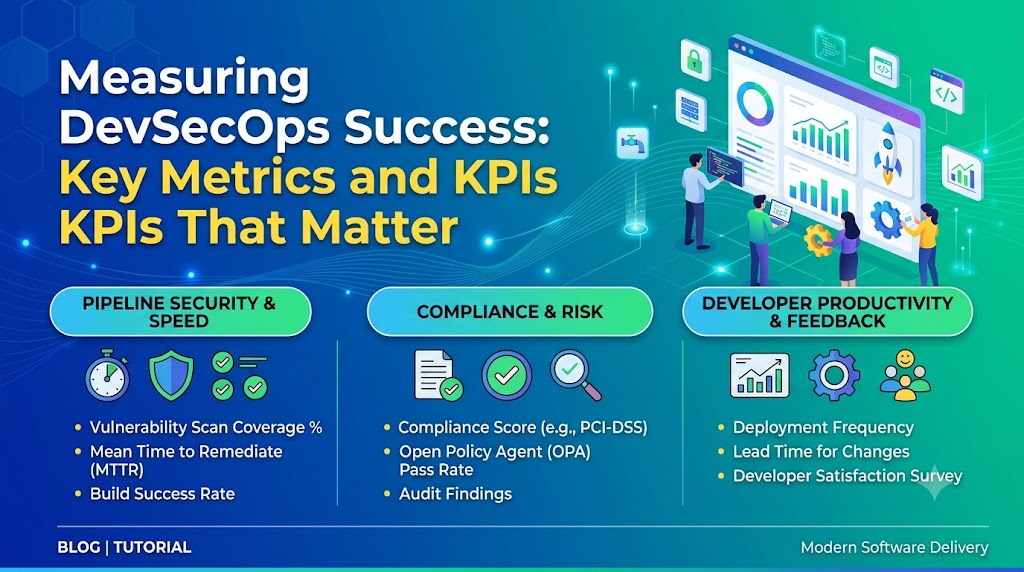
Embedding security checks into automated continuous integration and continuous delivery (CI/CD) pipelines has become a core standard for software teams. Organizations regularly activate code scanners, set up deployment guardrails, build software bills of materials (SBOMs), and audit infrastructure configurations. Despite these investments, leadership often struggles with the same fundamental question: Are applications genuinely more secure, or are teams simply running more tools?
Counting the tools in a pipeline is not an indicator of security posture. A suite of scanners running on every build shows activity, not risk reduction. To determine whether engineering efforts actually strengthen resilience, organizations need an objective, practical measurement model.
Measuring DevSecOps success requires focusing on metrics that reveal real exposure reduction, pipeline throughput, developer remediation speed, and software supply chain integrity.
What DevSecOps Success Really Means
DevSecOps success represents an engineering team’s ability to ship dependable, resilient software quickly while proactively identifying and mitigating risks across the development lifecycle.
Achieving this balance means managing several operational priorities:
- Lowering overall risk without compromising release schedules.
- Catching defects early in feature branches before they reach staging or production.
- Expanding automated test coverage across code repositories, container images, and cloud configurations.
- Preventing recurring flaw patterns through shared engineering standards and automated guardrails.
- Safeguarding third-party dependencies and build artifacts from supply chain tampering.
- Fostering shared ownership between application security, development, and platform operations.
No single data point reflects overall DevSecOps maturity. A low total finding count can point to secure code, but it can just as easily indicate a disabled scanner or misconfigured rule set. In contrast, an automated gate that halts dozens of releases might indicate strict policy enforcement, but it could also highlight brittle rules that frustrate engineers and slow delivery. An effective measurement approach examines both security effectiveness and developer workflow friction.
Why DevSecOps Metrics Matter
Engineering programs improve when their performance is clearly understood. Without intentional measurement, security initiatives turn into reactive firefighting, ad-hoc patching, and unmanageable alert queues.
A deliberate metrics program delivers three key advantages:
- Risk-Based Prioritization: Teams tackle vulnerabilities based on actual exploitability, internet exposure, and service importance rather than blindly reacting to raw scanner outputs.
- Workflow Optimization: Tracking pipeline scan times, false-alarm rates, and triage backlogs highlights process bottlenecks before developers start bypassing security controls.
- Shared Accountability: Clear data turns security into a standard quality metric—similar to test coverage, system uptime, and bug density—rather than an external compliance hurdle.
Key DevSecOps Metrics and KPIs
A dependable measurement strategy groups metrics into functional areas rather than presenting a disconnected list of numbers.
1. Vulnerability Detection and Remediation
Detection tells you what was discovered; remediation tracks your team’s ability to fix it.
- Active Vulnerabilities by Severity: The current backlog of unresolved issues grouped by risk level (such as Critical, High, Medium, and Low). This reflects immediate technical exposure across active services.
- Mean Time to Remediate (MTTR): The average calendar duration from the moment a vulnerability is confirmed until its validated fix is deployed.
- Remediation SLA Compliance: The proportion of issues resolved within an organization’s committed response window (for instance, fixing Critical items within 7 days and High items within 30 days).
- Age of Unresolved High-Risk Findings: How long open Critical and High findings have lingered in the backlog. This prevents older, neglected vulnerabilities from getting lost behind aggregate averages.
- Pre-Production Detection Share: The percentage of flaws identified during development, pull request reviews, or automated test builds compared to issues discovered in production.
- Defect Recurrence Rate: The frequency with which an identical vulnerability or known antipattern reappears in the same component after being marked resolved.
2. Security Testing and Coverage
Coverage metrics reveal the breadth and accuracy of security testing across your application catalog.
- Automated Check Coverage: The percentage of active code repositories and services that execute mandatory security scans in their pipelines.
- Tool-Specific Pipeline Reach: Separate tracking for static code analysis (SAST), dependency auditing (SCA), dynamic application testing (DAST), secret scanning, and infrastructure-as-code (IaC) verification across builds.
- Actionable Finding Ratio: The proportion of scanner alerts that translate into legitimate code fixes rather than immediate rule dismissals or permanent suppressions.
- Estimated False-Positive Rate: The percentage of reported alerts confirmed to be non-issues during triage. Noisy scanners damage developer trust and cause alert fatigue.
- Ownership Assignment Rate: The percentage of newly discovered issues that automatically or manually route to an identified code owner or product backlog.
3. CI/CD Pipeline Security
These indicators show how automated security policies influence daily build workflows.
- Security Gate Failure Rate: The percentage of build or deployment runs blocked by policy gates. Sudden increases usually signal either freshly introduced risks or miscalibrated policy rules.
- Pipeline Scan Overhead: The extra runtime added to automated builds by security checks. Lengthy scans prompt developers to skip or disable checks to preserve delivery speed.
- Policy Violations Resolved Pre-Merge: The volume of security issues caught and fixed directly on feature branches before code is merged into main branches.
- Unverified Artifact Detections: How often deployment platforms catch and block unvetted, unsigned, or unverified packages attempting to deploy into runtime environments.
4. Developer Feedback and Remediation Efficiency
A healthy security culture ensures developers receive quick, contextual guidance to fix flaws easily.
- Time to Detect: The duration between the commit that introduced an issue and the moment a scanner flags it.
- Time to Developer Notification: How quickly actionable scan results appear inside the developer’s normal workflow, such as pull request comments or task boards.
- Triage and Handoff Speed: The time required for security leads or automated triage tools to review an alert and assign it to an engineer.
- Reopened Finding Rate: The frequency with which resolved issues fail verification testing or reappear in subsequent release builds.
5. Software Supply Chain Security
Modern systems rely heavily on third-party libraries and container layers, making supply chain tracking essential.
- SBOM Coverage Rate: The percentage of software releases that automatically generate, verify, and store a comprehensive Software Bill of Materials.
- Continuous Dependency Monitoring: The proportion of open-source packages and base container images actively tracked against fresh vulnerability advisories.
- Artifact Provenance Verification: The proportion of production workloads validated for cryptographic signatures and verified build sources prior to execution.
- Approved Registry Compliance: The percentage of runtime dependencies pulled strictly from curated, vetted internal registries.
6. Security Outcomes and Risk Reduction
Outcome indicators evaluate whether DevSecOps practices translate into fewer real-world security failures.
- Escaped Defects in Production: The volume and severity of vulnerabilities discovered after release via penetration tests, bug bounty programs, or security audits.
- Incidents from Known Weaknesses: Production security events caused by flaws that were already flagged by scanning tools but left unresolved.
- Policy Exceptions and Overdue Approvals: The total count of temporary security bypasses granted, along with the percentage that remain open past their agreed expiration date.
Practical Metric Calculations and Examples
Consistent calculations make it easier to compare performance across squads and quarters. Expressing these calculations plainly keeps them accessible to engineering teams and leadership alike.
Mean Time to Remediate (MTTR)
Calculate MTTR by dividing the total calendar days spent resolving a group of vulnerabilities by the total number of resolved vulnerabilities in that set.
To keep this figure meaningful, always calculate it separately for each severity level and track it across closed issues within a fixed reporting window.
Practical Example:
Suppose a backend squad fixes 4 Critical vulnerabilities during a monthly sprint:
- Finding A took 3 days to fix.
- Finding B took 5 days to fix.
- Finding C took 2 days to fix.
- Finding D took 10 days to fix.
Adding these durations together yields 20 total days. Dividing 20 days by the 4 resolved findings results in an average Critical MTTR of 5 days.
Interpreting the Result: An average of 5 days indicates solid overall responsiveness. However, team leads should still review Finding D to understand why resolving that specific defect took twice as long as the others.
Remediation SLA Compliance Rate
Determine SLA compliance by taking the number of vulnerabilities resolved within your defined policy deadline, dividing it by the total number of eligible vulnerabilities due in that reporting timeframe, and multiplying by 100 to get a percentage.
Practical Example:
Over a quarter, an engineering group is responsible for resolving 50 High-severity issues under an internal policy target of 30 days:
- 42 vulnerabilities are resolved within the 30-day window.
- 8 vulnerabilities take longer than 30 days to resolve.
Dividing 42 by 50 and multiplying by 100 yields an SLA compliance rate of 84 percent.
Interpreting the Result: The team resolved the majority of issues on schedule. The 16 percent non-compliance rate highlights a backlog of delayed fixes that warrant investigation into staffing capacity or complex third-party dependencies.
Automated Security Test Coverage
Calculate coverage by dividing the count of active repositories with automated security checks enabled by the total count of active repositories, then multiplying by 100.
Archived or deprecated codebases should be excluded from the total count so the final percentage reflects only active production services.
Vulnerability Recurrence Rate
Determine recurrence by taking the count of resolved defects that reappear under identical conditions, dividing that by the total sample of resolved defects, and multiplying by 100.
An identical flaw returning to the same component usually indicates an incomplete patch, a missing regression test, or a recurring design antipattern.
Building an Actionable DevSecOps Dashboard
A useful dashboard helps teams make decisions rather than overwhelming them with raw counts.
| Dashboard Focus | Core Metric | Data Origin | Target / Trajectory | Responsible Owner | Primary Action Triggered |
| Exposure | Open Critical and High findings | SCA, SAST, container scans | Zero Criticals older than 7 days | Engineering Leads | Allocate sprint capacity to security fixes when thresholds are exceeded. |
| Turnaround | MTTR by severity tier | Jira, GitHub Issues | Critical under 7d, High under 30d | Product / Dev Leads | Unblock triage delays and balance security tasks with product features. |
| Pipeline Health | Security scan duration | CI server run logs | Under 3 minutes added to builds | Platform / CI Engineers | Optimize rules, shift heavy scans to asynchronous jobs, or cache dependencies. |
| Coverage | Repositories with active CI checks | Version control systems | 100% of production repositories | AppSec / Platform Teams | Identify unmonitored codebases and onboard missing repos into automated pipelines. |
| Signal Quality | False-alarm suppression rate | Security triage logs | Steady downward trend (under 15%) | AppSec Engineers | Refine scanner rules, prune noisy checks, and update custom policies. |
| Supply Chain | SBOM generation & signed artifacts | Build systems & registries | 100% of release artifacts signed | Release / Security Teams | Block untrusted packages and track vulnerable third-party components. |
A well-structured dashboard emphasizes historical trends, distinguishes severity levels, accounts for service criticality, and assigns every issue to an owner.
Setting Realistic and Risk-Based Targets
Setting arbitrary deadlines—such as demanding every flagged flaw be resolved in 48 hours—leads to alert fatigue, missed goals, and teams finding ways to game the numbers. Targets should match real-world risk, system architecture, and team capacity.
Clarifying key target types helps set clear expectations:
- Service-Level Objective (SLO): An internal target used by development and security teams to monitor daily performance (such as resolving 90 percent of High issues within 20 days).
- Service-Level Agreement (SLA): A mandatory threshold linked to contractual, regulatory, or organizational compliance that triggers formal reviews when missed.
- Internal Remediation Target: An adjustable operational goal that helps teams organize sprint priorities.
When setting targets, consider four operational factors:
- Service Criticality and Network Exposure: A critical vulnerability on an internet-facing gateway requires immediate remediation. The same flaw in an isolated test environment running on an internal subnet carries a much lower real-world risk.
- Real Exploitability: Scanners report theoretical vulnerabilities. If a vulnerable library function is never invoked by application code, the practical exposure is limited, allowing for adjusted remediation timelines.
- Historical Baselines: Establish baselines by collecting 60 to 90 days of performance data before setting strict deadlines. Mandating a 5-day turnaround when the historical average is 40 days will discourage the team.
- Deployment Cadence: High-velocity teams deploying multiple times per day can release fixes much faster than groups maintaining monolithic architectures bound to monthly manual regression schedules.
Common Mistakes in DevSecOps Measurement
Avoid these frequent pitfalls when building a measurement program:
- Relying Solely on Total Scan Volume: Running thousands of scans shows that automation exists, but it offers no insight into whether flaws are being prioritized or fixed.
- Incentivizing Zero-Finding Reports: Rewarding developers purely for reporting zero issues encourages teams to silence scanners, suppress rule sets, or misclassify findings.
- Over-relying on MTTR Averages: Averages conceal long-tail risks. Resolving four minor flaws in 2 days alongside one critical flaw that sits open for 120 days produces a misleadingly respectable average. Always review backlog age alongside MTTR.
- Ignoring Pipeline Delays and Noisy Alerts: Scanners that flag dozens of irrelevant warnings or add 30 minutes to every pull request prompt developers to disable checks or disregard alerts entirely.
- Comparing Teams with Different Architectures: Benchmarking a modern cloud-native microservice team against a legacy monolithic system without adjusting for complexity produces misleading performance comparisons.
- Using Metrics to Assign Blame: Measuring security must never turn into a tool for punishing individual developers. Blame encourages concealment, whereas constructive visibility builds shared ownership.
Practical Implementation Roadmap
Building a DevSecOps measurement framework works best as an incremental rollout. Start with core, high-impact indicators before expanding to advanced operational checks.
- Establish Core Priorities: Identify critical systems and clarify the security and delivery improvements the organization wants to see.
- Audit Workflows and Tooling: Map current CI/CD pipelines, source repositories, and existing security tools to spot blind spots.
- Pick a Focused Initial Metric Set: Begin with 3 or 4 foundational metrics, such as Test Coverage, Open Vulnerability Backlog, and MTTR by severity.
- Standardize Definitions and Data Sources: Document how each metric is calculated, where its data originates, and who owns the follow-up actions.
- Establish Historical Baselines: Collect 30 to 60 days of data to assess current turnaround times and coverage rates before enforcing deadlines.
- Set Risk-Calibrated Targets: Define realistic SLOs and remediation timelines based on system importance and exposure.
- Deploy Actionable Dashboards: Create shared dashboards that highlight trend lines, aging issues, and direct ownership.
- Hold Regular Cross-Functional Reviews: Review metrics during sprint retrospectives and planning sessions with development, security, and operations teams.
- Eliminate Operational Bottlenecks: Address root causes behind delayed remediations, noisy scanners, or lengthy pipeline stages.
- Refine the Framework Continuously: Expand measurements to include software supply chain integrity, artifact signing, and developer feedback loops as workflows mature.
Teams seeking to build internal skills often turn to structured educational resources. DevOpsSchool provides industry-aligned training programs in DevSecOps, site reliability engineering, and CI/CD automation that help teams establish standardized delivery pipelines, implement modern security practices, and measure operational performance effectively.
Frequently Asked Questions (FAQ)
What are the most important DevSecOps metrics to start with?
Teams beginning their measurement journey should focus on three foundational metrics: Automated Security Test Coverage to see which codebases are actively monitored, Mean Time to Remediate by severity to gauge fix turnaround times, and the Age of Open Critical Vulnerabilities to prevent high-risk issues from lingering unresolved.
Why is vulnerability count alone an unreliable security metric?
A simple count of vulnerabilities overlooks exploitability, system exposure, and business impact. A spike in reported issues often indicates improved scanner coverage or updated rule definitions rather than a drop in security quality. Conversely, a low count might simply reflect unmonitored services or overly broad suppression rules.
How do teams measure CI/CD security coverage accurately?
CI/CD security coverage is calculated by taking the count of active, production repositories running required automated checks—such as SAST, SCA, and container scans—and dividing it by the total count of active repositories. Archived, experimental, or read-only projects should be excluded to ensure the percentage accurately reflects the live portfolio.
What is the difference between an SLA and an SLO in vulnerability remediation?
A Service-Level Objective (SLO) is an internal target used by development and security teams to guide daily sprint planning and monitor performance trends (such as aiming to resolve 90 percent of High issues within 30 days). A Service-Level Agreement (SLA) is a formal, mandatory policy linked to contractual or regulatory standards that triggers formal escalations when missed.
How often should engineering and security teams review DevSecOps metrics?
Pipeline-level metrics—such as build blockages, new critical alerts, and scan duration—should be tracked continuously and reviewed during weekly sprint meetings. Broader strategic trends—such as MTTR trajectories, quarterly SLA compliance rates, and repository coverage growth—are best evaluated monthly or quarterly by engineering leadership.
Measuring DevSecOps success requires moving beyond superficial counts of completed scans and deployed tools. By tracking metrics that reflect remediation speed, pipeline coverage, developer velocity, and supply chain integrity, organizations can build a balanced framework that safeguards software assets while sustaining delivery speed.
